


 888-815-3649
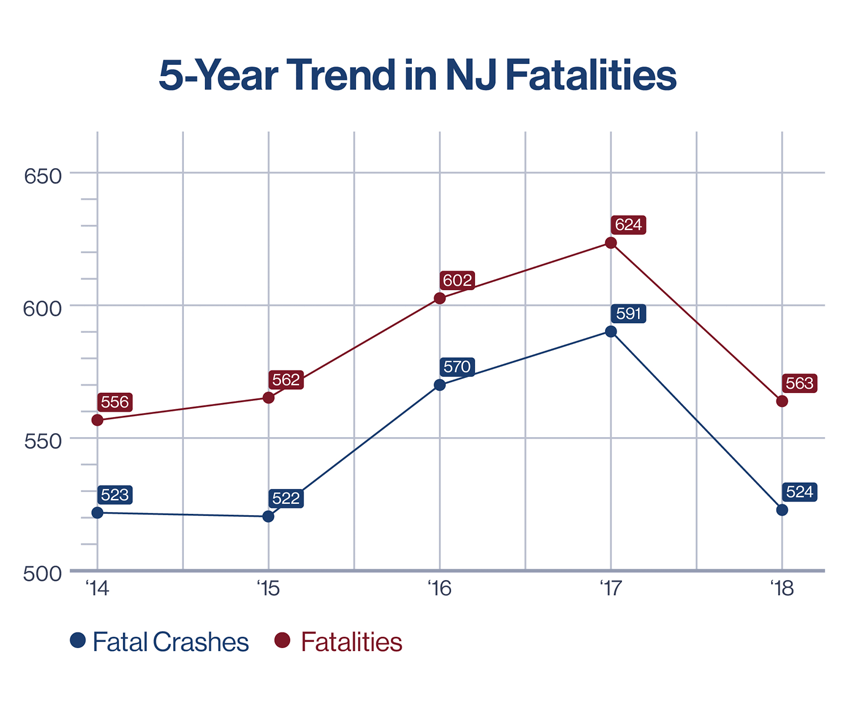
New Jersey saw 278,413 car accidents in 2018. Of those, 61,043 caused injuries and 524 were fatal, claiming 563 lives. This reflects a decrease over the prior two years and a return to numbers seen in 2014 and 2015, as the following graph shows.
The state is well known as a dangerous place to drive due to its population density and proximity to major cities of New York and Philadelphia. If you are a new driver, the parent of a teen getting on the road, or just someone who wants to learn more about the facts of driving in New Jersey, this is the article for you.
#1: Leading Cause of Accidents in NJ: Distracted Driving
The leading cause of automobile accidents in New Jersey is distracted driving. Nationally, 2,841 people were killed by distracted driving in 2018. That averages out to roughly 8 people per day killed by distracted driving. The National Highway Transportation Administration reported that 8.5% of all accident fatalities are caused by distracted driving. The NJ State Police Department Fatal Accident Investigation Unit found that 146 of those deaths happened in New Jersey.
Anything that pulls your focus away from the road is a distraction. There are 3 main types of distraction, according to the National Highway Traffic Safety Administration:
- Visual: taking your eyes off the road
- Manual: taking your hands off the wheel
- Cognitive: taking your mind off driving
Common forms of distraction include eating and drinking, talking to passengers, daydreaming, looking at scenery, and, of course, cell phone use.
The NJ Department of Transportation found that, in 2018, 1,392 car accidents were caused by cell phone use, resulting in nearly 500 injuries. Just over one thousand (1,015) were related to handheld usage and 377 were related to hands-free use. Read this article to learn more about accidents involving texting while driving.
Distracted Driving Teens
Teen drivers are at high risk for distraction-related accidents. Car accidents are the second leading cause of death among teenagers. Nationally, 2,121 people were killed in accidents involving a teen driver in 2018. In the same year, 297,000 teens were injured in car accidents.
Teen drivers often engage in risky behavior. Of all distracted driving accidents, 25% involved a teen driver. In a nationwide survey, 43% of teens have admitted to not always wearing a seat belt while driving. In the same survey, 39% of drivers between the ages of 15 and 18 admitted to having texted or emailed while driving within the past 30 days. Nearly 11% of teens reported driving drunk within the past 30 days and 7% of those drivers were male.
#2: Pedestrians Struck by Vehicles
Pedestrian violations were the second leading cause of New Jersey vehicle accident fatalities in 2018. This is not surprising considering that pedestrians are largely unprotected from a collision with a several thousand pound vehicle. Pedestrians aged 45-54 were killed most frequently in New Jersey in 2018. The most dangerous time for pedestrians is from 6 PM to 9 PM. Most pedestrians who were killed were struck by passenger cars. The leading causes for pedestrian accidents are failure to yield to right of way, improper crossing of intersections, and poor visibility.
When not fatal, pedestrian injuries tend to be serious. Approximately 137,000 pedestrians across the country went to the emergency room for crash-related injuries in 2017. A seven-year study found that an average of 264 pedestrians are severely injured each year in New Jersey. Surprisingly, only 28% of severe pedestrian crashes occur at intersections.
Follow this link to learn more about pedestrian accidents.
#3: Accidents Caused by Speeding
Speeding was the third leading cause of fatal accidents in 2018. In 2017, 19% of speeding fatalities took place in New Jersey. Nationally, 9,378 people died due to speeding accidents in 2018. Nearly half of all speeding accident victims were not wearing seat belts. The majority of speeding-related accidents were caused by men ages 15-24. Out of all 2018 speeding accidents in New Jersey, 74% took place during snowy and icy conditions.
Speeding increases the likelihood of severe injuries. The World Health Organization found that an increase in average speed of just .6 miles per hour typically results in a 3% higher risk of a crash involving injury. The majority of speeding injuries are caused by driving too fast for road conditions as opposed to failing to observe the posted speed limit.
Drunk drivers are twice as likely to have been speeding during an accident. Most accidents that involve both speeding and alcohol impairment take place between 9:00 p.m. and 3:00 a.m.
Speeding is an extremely costly behavior. The National Highway Traffic Safety Administration estimates that speeding accident’s total cost to society is $40.4 billion per year. In New Jersey, a speeding ticket can cost a driver between $85 and $260. A speeding violation can also lead to increased auto insurance premiums and up to five points on the driver’s license.
Drunk Driving Accidents
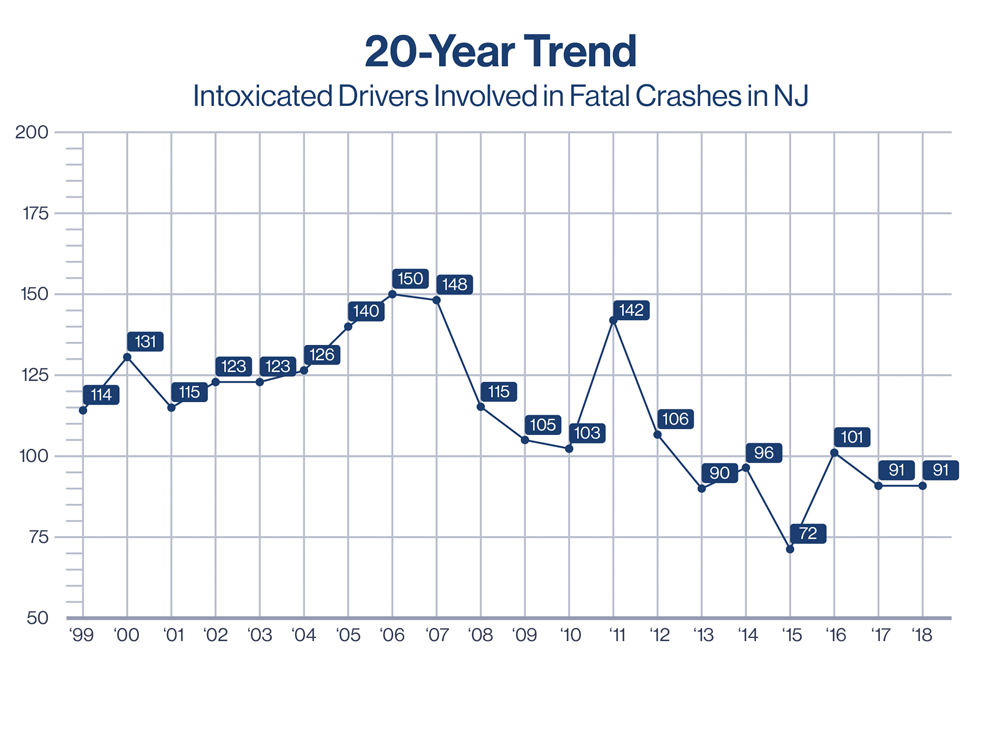
Of all 2018 accidents in New Jersey, 11.7% of drivers were legally intoxicated. In New Jersey, 36% of drivers killed were under the influence of alcohol. Nearly one third of pedestrians killed were under the influence. This line graph shows the 20-year trend (from 1999 to 2018) in drunk driving fatalities in New Jersey.
Collision with a stationary object was the leading cause of fatalities among both drunk and drug-impaired drivers in New Jersey. The second leading cause was head-on collisions. The vast majority of DWI accidents took place while driving straight ahead. Most drunk driving accidents took place in passenger cars.
In New Jersey, men are more than twice more likely than women to die from driving while drunk. The age range most likely to suffer a fatal drunk driving accident is 30-39 year olds, followed by drivers aged 50-64.
More information about drunk driving in New Jersey can be found in this Rosenblum Law article.
Where Do Accidents Happen in NJ?
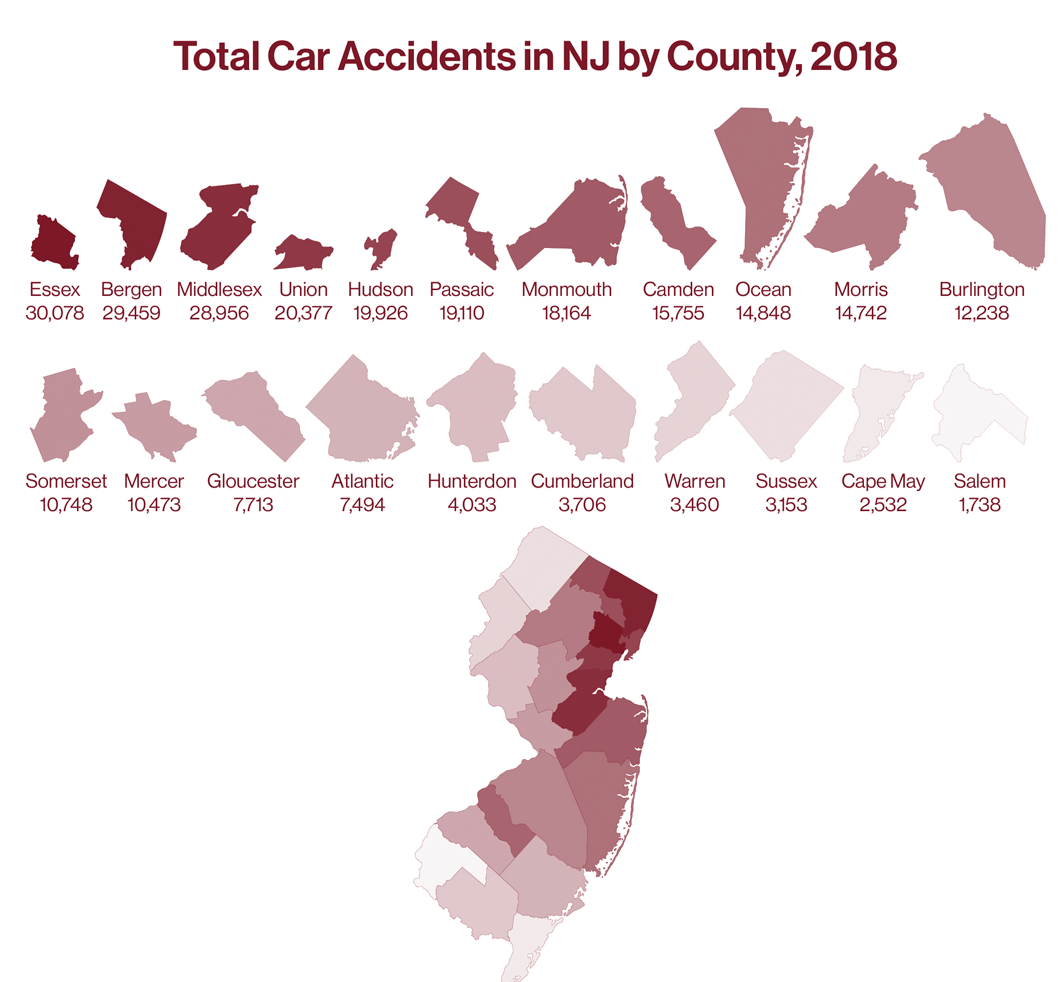
In 2018, Essex County had the most accidents in all of New Jersey: 30,078. Bergen County followed closely with 29,459. This is not surprising since both of these counties are densely populated. Salem County had the least number of accidents in 2018. These maps show a breakdown of each county’s accident statistics:
Injuries and Fatalities by County
Given all of the accidents in the state, it’s not surprising that many resulted in injuries and fatalities. New Jersey saw 61,043 injuries resulting from car accidents. The most, 6,779, occured in Essex County, followed closely by 6,292 in Bergen, and 4,299 in Passaic.
In 2018, 558 people died in car accidents in New Jersey. Camden County saw the highest number of accident fatalities: 46 total. Gloucester and Bergen were tied for second highest, with 42 deaths each.
Most Dangerous Routes, Roads, and Intersections in New Jersey
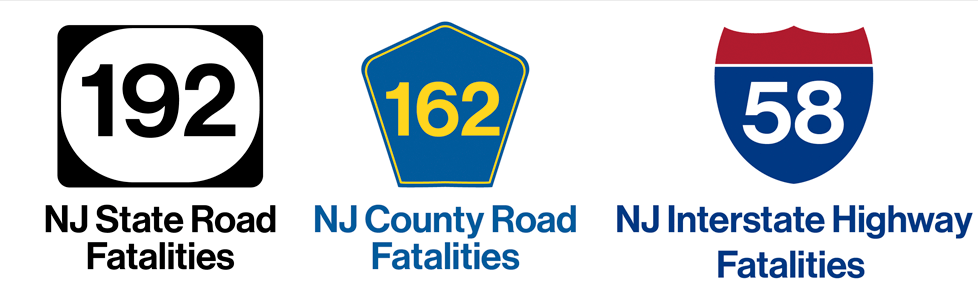
The majority of fatal accidents in New Jersey occur on state roads, which saw 192 fatalities in 2018. New Jersey county roads followed closely, with 126 fatalities in the same year and accidents on New Jersey interstate highways claimed the lives of 58 people. Straight and level roads were host to 243 fatalities, while 139 fatalities took place at intersections, and 68 fatalities happened on curved and level roads, according to a NJ State Police report.
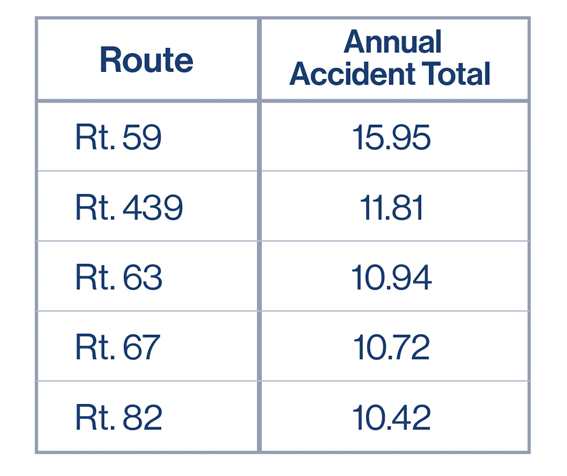
The top 5 most dangerous New Jersey roadways are Rt. 59, Rt. 439, Rt. 82, Rt. 67, and Rt. 63, which together averaged around 12 accidents each in 2018. This table shows the annual accident total for each of these roadways.
There were 58 fatalities on the state’s interstate highways in 2018. Highway I-95, which includes sections of the New Jersey Turnpike, saw 14 fatalities, the highest number of 2018. Highway I-80 saw 13 deaths in New Jersey that same year.
Time Magazine included the intersection of Spring Street and East Jersey Street in Elizabeth, NJ in its list of the top 11 most dangerous intersections in the country. The intersection of I-95 and Route 4 in Fort Lee, NJ was named the second most congested in the country. There were 173 accidents at the intersection of Paulus Boulevard and Route 18 in New Brunswick, according to the NJ Department of Transportation.
What Are the Most Dangerous Types of Vehicles?
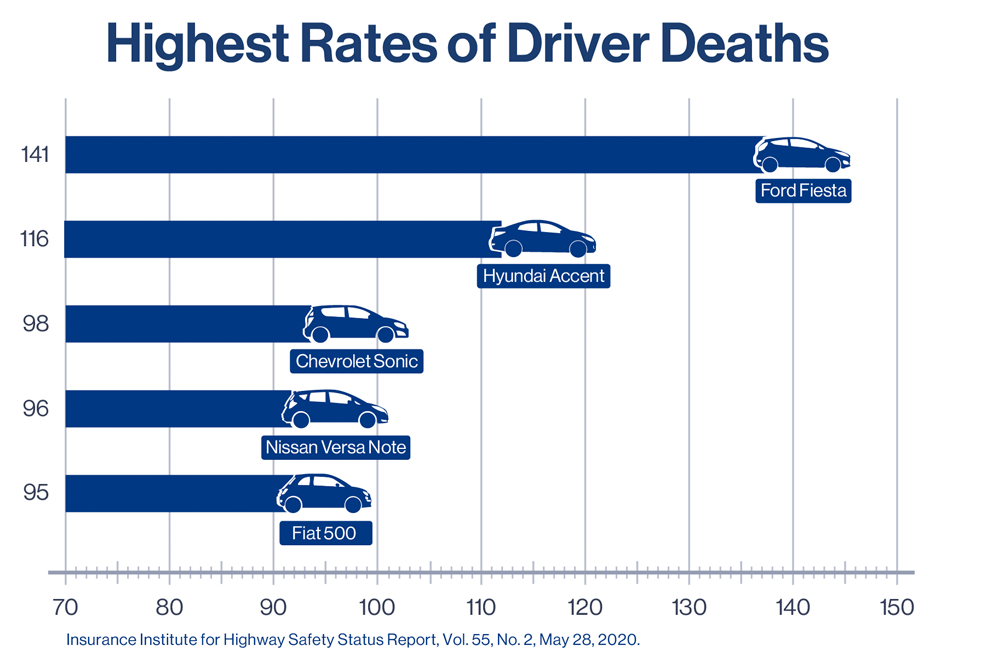
In New Jersey, the majority of fatal accidents took place in passenger cars, followed by light trucks. Of all passenger cars, 4-door sedans with a hardtop were involved in the most accidents in 2018. Out of all light trucks, compact utility trucks were the most likely to get into a fatal accident.
According to the Insurance Institute for Highway Safety, these were the cars with the most frequent occupant fatalities between 2015 and 2018:
Accidents by Day, Month, Time, and Weather
The NJ State Police found that the majority of fatal accidents take place on Sundays, followed by Mondays.
In New Jersey, the most dangerous month to drive is July, in which 55 people died in 2018.
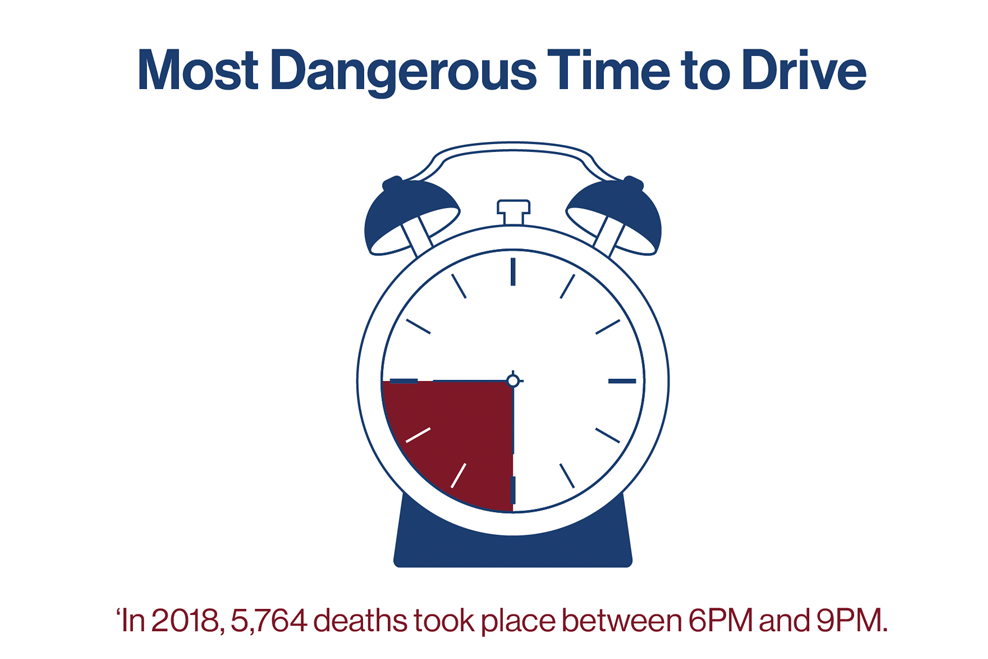
Nationally, the most dangerous time to drive is from 6 PM to 9PM. In 2018, 5,764 deaths took place during that window and 94 of those took place in New Jersey.
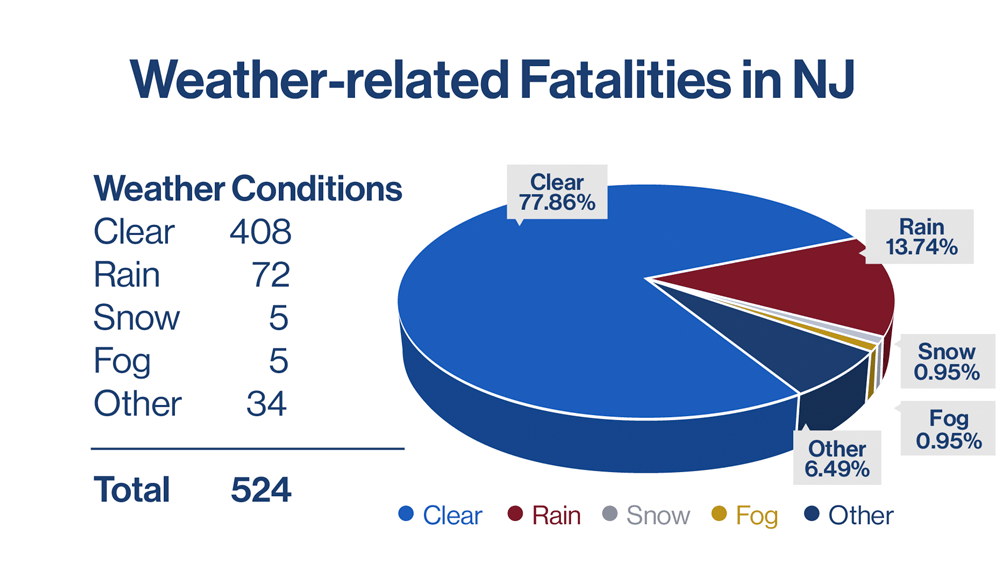
Nationally, 2,755 fatal accidents occured in rainy conditions and 512 died in accidents when it was snowing in 2018. This pie chart depicts the weather-related traffic fatalities in New Jersey in 2018, according to the New Jersey State Police.
Who Is Most Likely to Die in a Car Accident?
The NJ State Police reported that, on average, 73% of fatal car accident victims are male. In 2018, 386 men and 178 women died in auto accidents.
During 2018, 85 New Jersey residents over the age of 74 died in a car crash. That is the highest number, followed by 45-54 year olds and 23-34 year olds, 84 of whom lost their lives in auto accidents in New Jersey the same year.
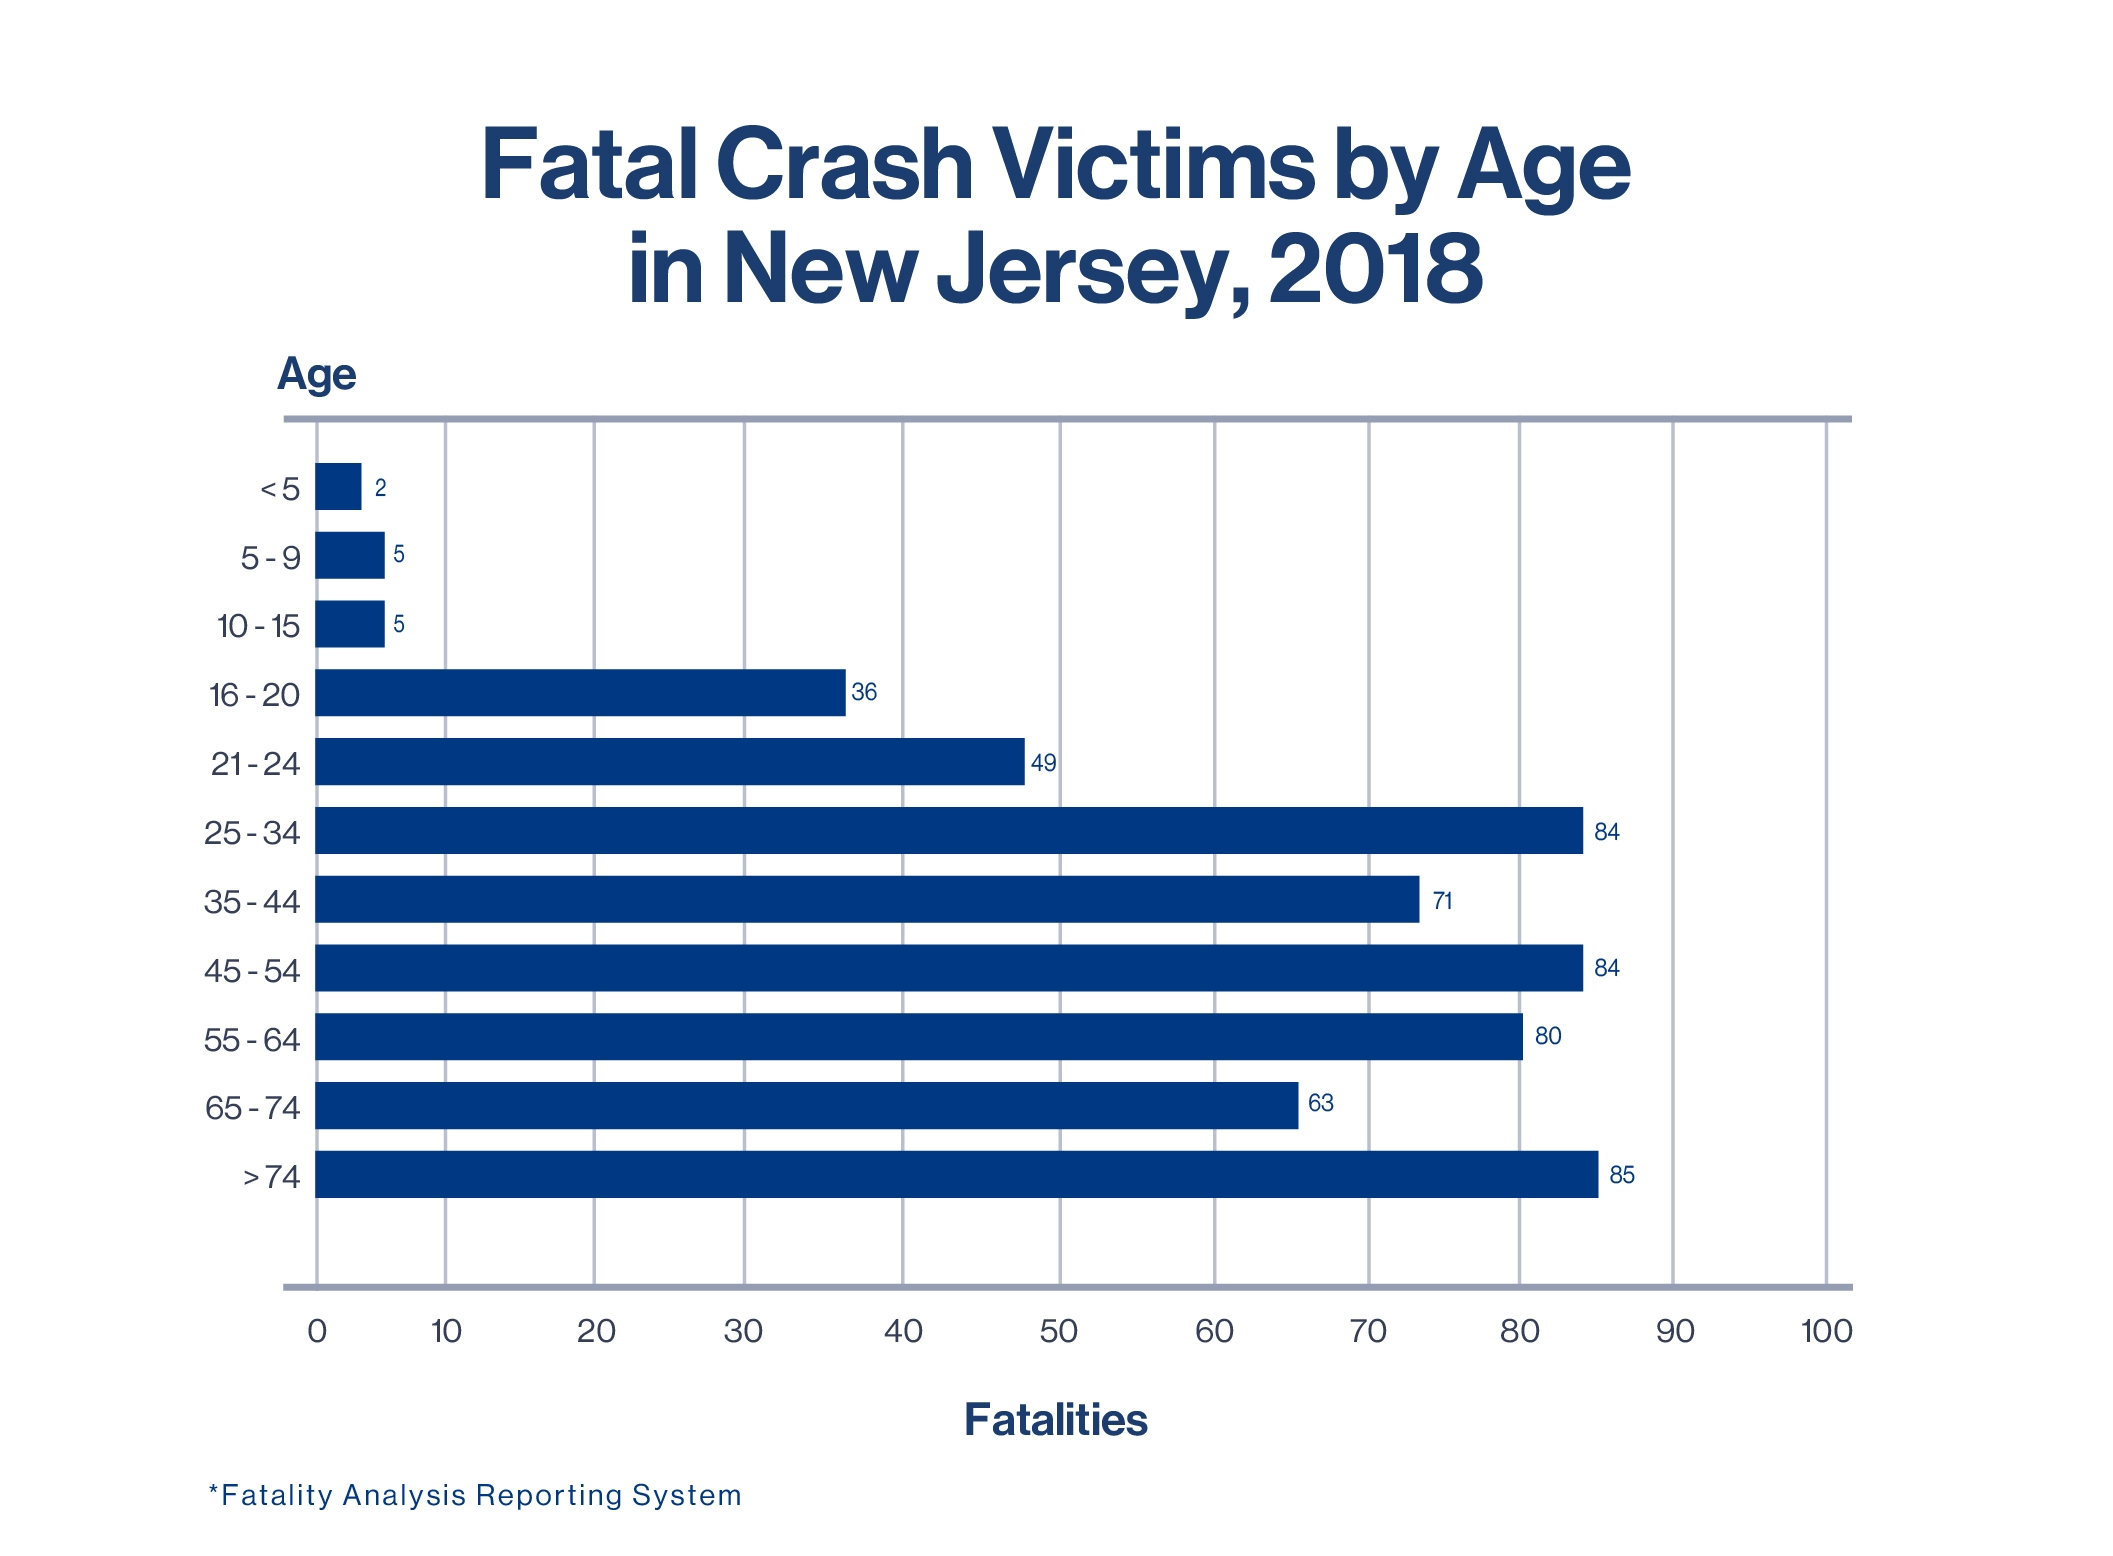
On a national level, the most at-risk driving age range is 25-34 year olds, who suffered 6,733 fatalities in 2018.
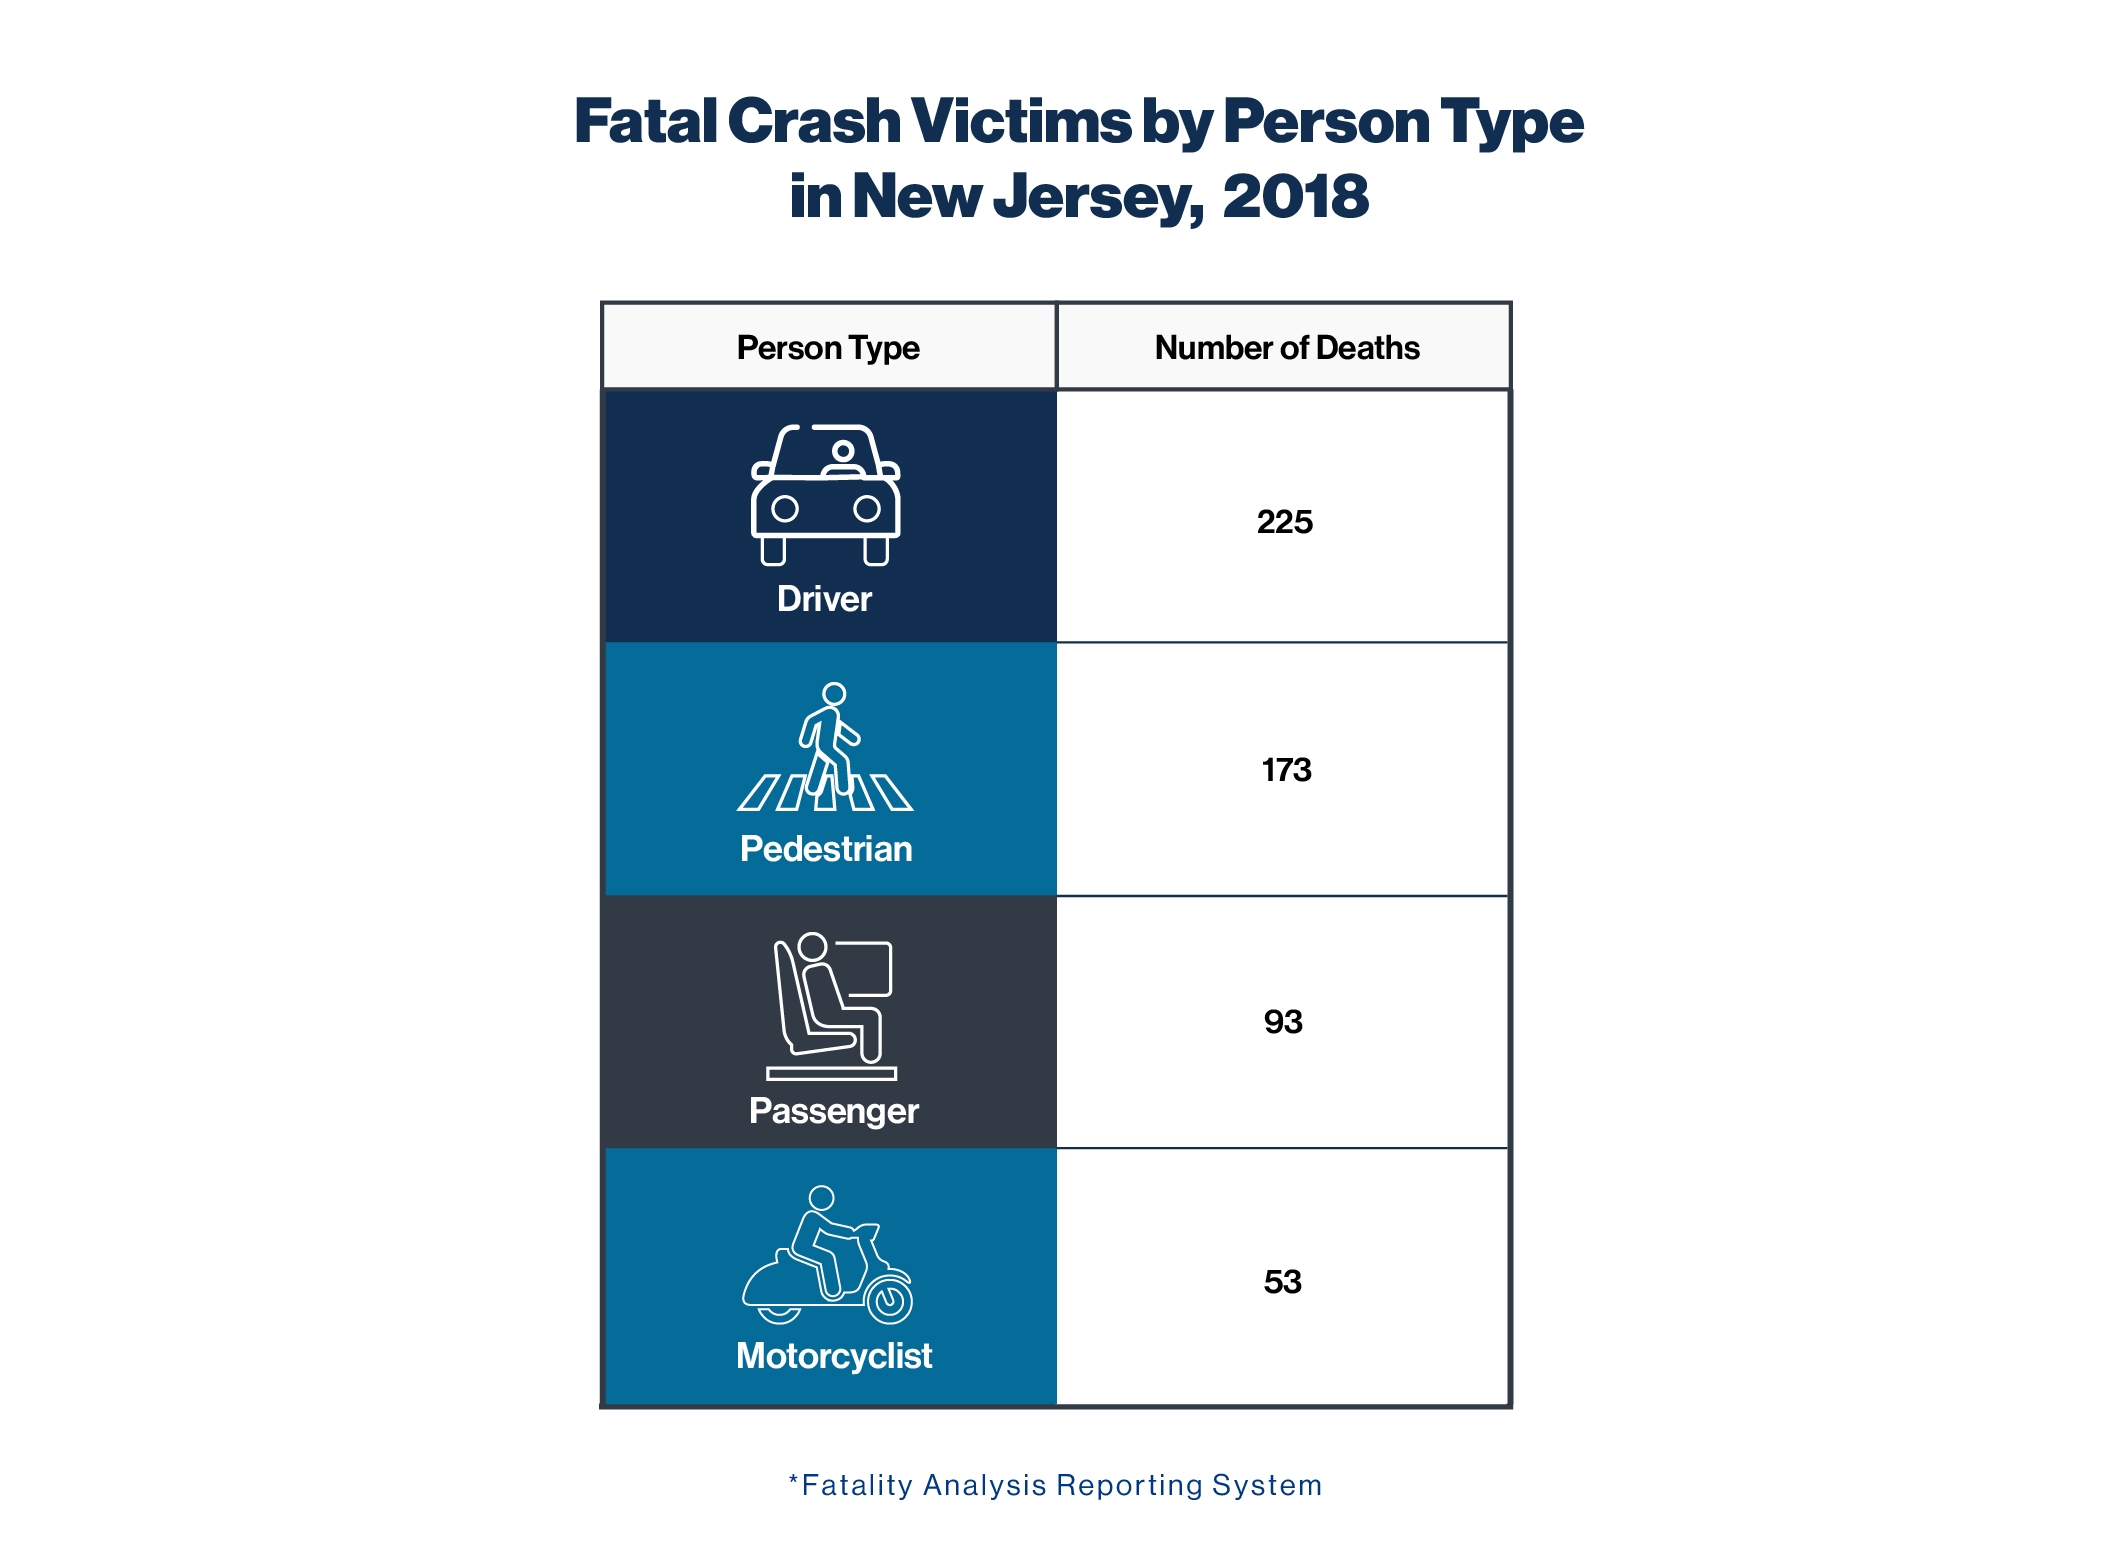
Vehicle drivers are the most at-risk during traffic accidents in New Jersey, followed by pedestrians, passengers, then motorcyclists. This table provides a breakdown of fatal crash victims for 2018:
How Much Do Accidents Cost?
Car accidents cost lives and cause temporary and permanent injuries to victims, as well as property damage. According to the CDC, car accidents cost New Jersey residents $9 million in medical costs and $789 million in lost wages, which amounts to $798 million spent on fatal crashes alone in 2018. This table captures the breakdown of these costs to New Jerseyans:
| Vehicle Type | Amount of Money Spent on Accidents |
| Motor Vehicle Occupants | $469 Million |
| Pedestrians | $204 Million |
| Motorcyclists | $97 Million |
| Bicyclists | $25 Million |
Case Study: $50,000 (equivalent to $500,000 in today’s money)
What makes this case unique: Only 2 days to prepare and 1 day to find a key witness.
Who Should I Contact if I’ve Been Injured in a Car Accident in New Jersey?
Auto accidents can inflict anguish, trauma, and lasting physical and financial consequences on their victims. The dedicated, seasoned personal injury attorneys at Rosenblum Law are deeply committed to demanding those injured receive just compensation. E-mail or call us at 888-815-3649 for a free, no-obligation consultation.
